
The SAT score have been increased 90 points since 2013 and the SAT score went up and down almost every year at UM-Ann Arbor. Compared to similar schools, the submitted SAT and ACT scores are competitive and high at UM-Ann Arbor.
You can check and compare colleges with similar SAT scores UM-Ann Arbor by SAT score range 1370-1470, 1420-1520, and 1470-1570.
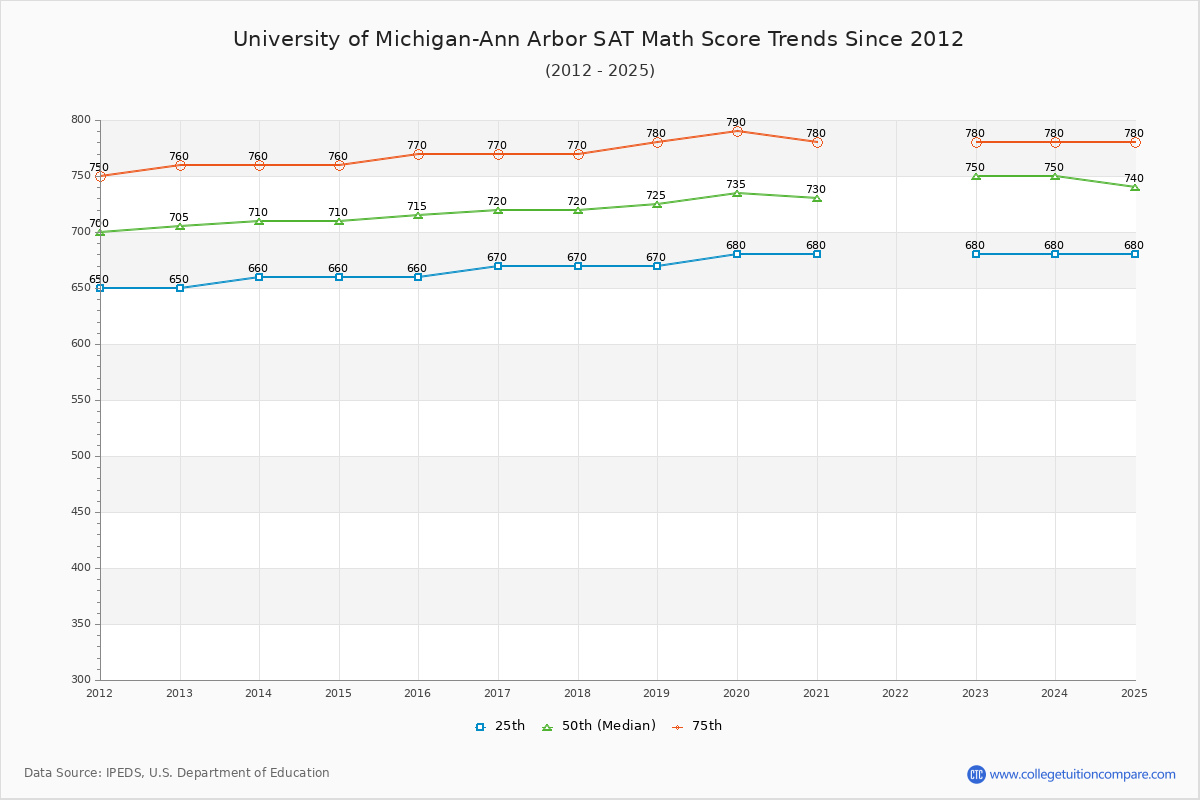
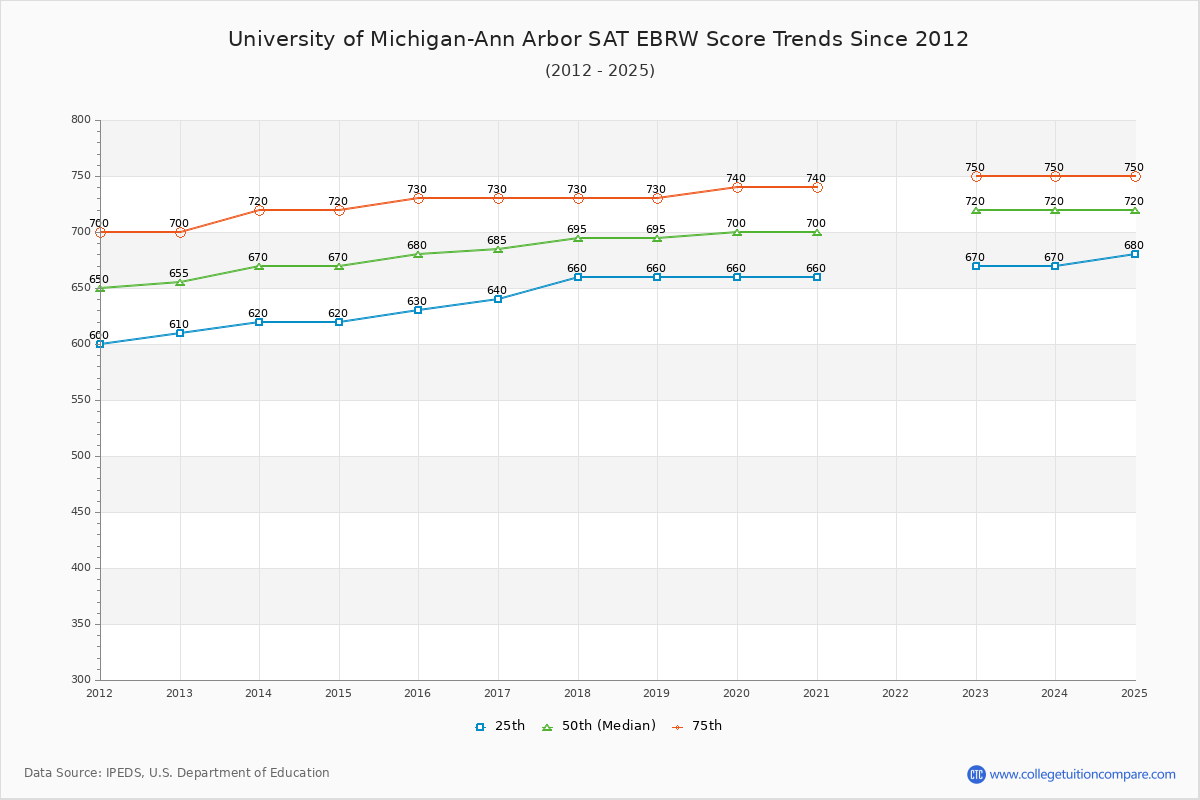
The 2024 SAT score is 1470 at UM-Ann Arbor. Over the past 12 years, the average SAT score is 1320 (25 th percentile) and 1508 (75 th percentile). Compared to similar schools, the submitted SAT scores are competitive and high at UM-Ann Arbor.
The following table and chart illustrate the changes in SAT scores at University of Michigan-Ann Arbor since 2013.
| Year | Total | Math | Evidence-Based Reading and Writing | ||||||
|---|---|---|---|---|---|---|---|---|---|
| 25 th | 50 th | 75 th | 25 th | 50 th | 75 th | 25 th | 50 th | 75 th | |
| 2013-14 | 1,280 | 1,380 | 1,480 | 660 | 710 | 760 | 620 | 670 | 720 |
| 2014-15 | 1,280 | 1,380 | 1,480 | 660 | 710 | 760 | 620 | 670 | 720 |
| 2015-16 | 1,290 | 1,395 | 1,500 | 660 | 715 | 770 | 630 | 680 | 730 |
| 2016-17 | 1,310 | 1,405 | 1,500 | 670 | 720 | 770 | 640 | 685 | 730 |
| 2017-18 | 1,330 | 1,415 | 1,500 | 670 | 720 | 770 | 660 | 695 | 730 |
| 2018-19 | 1,330 | 1,420 | 1,510 | 670 | 725 | 780 | 660 | 695 | 730 |
| 2019-20 | 1,340 | 1,435 | 1,530 | 680 | 735 | 790 | 660 | 700 | 740 |
| 2020-21 | 1,340 | 1,430 | 1,520 | 680 | 730 | 780 | 660 | 700 | 740 |
| 2021-22 | - | - | - | - | - | - | - | - | - |
| 2022-23 | 1,350 | 1,470 | 1,530 | 680 | 750 | 780 | 670 | 720 | 750 |
| 2023-24 | 1,350 | 1,470 | 1,530 | 680 | 750 | 780 | 670 | 720 | 750 |
| Average | 1320 | 1420 | 1508 | 671 | 727 | 774 | 649 | 694 | 734 |
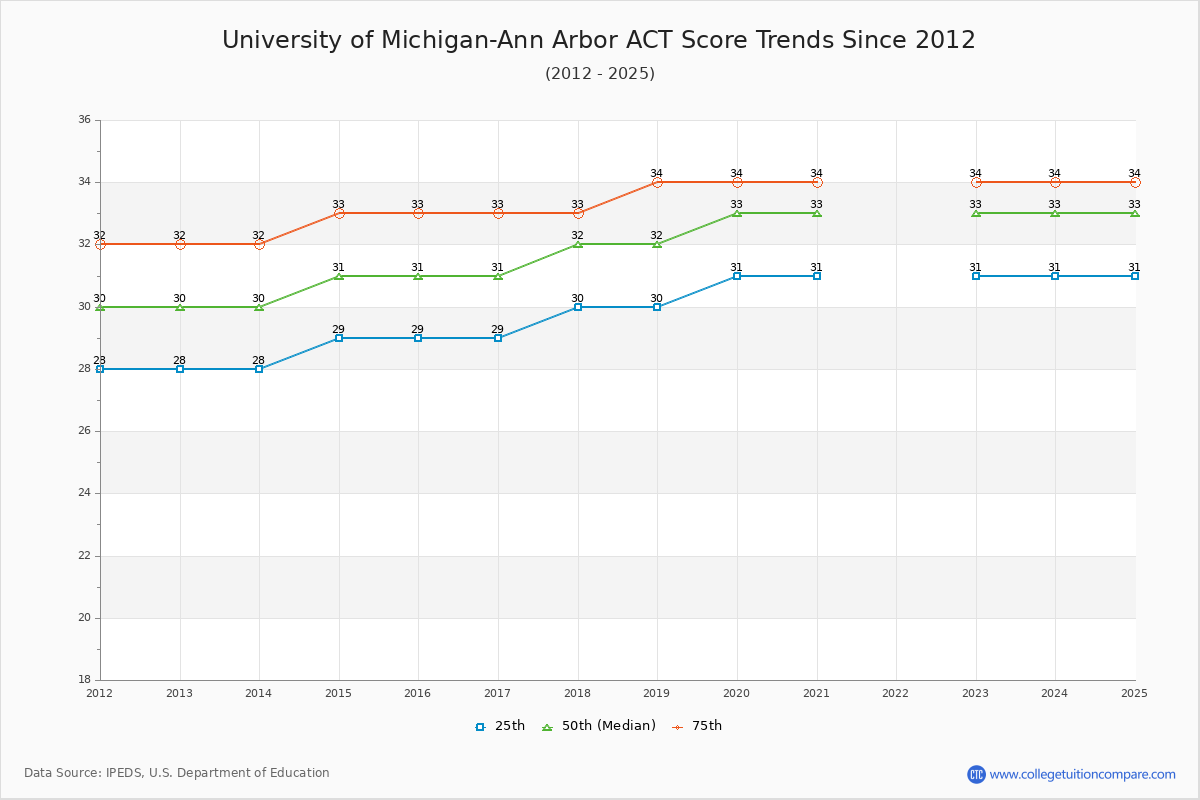
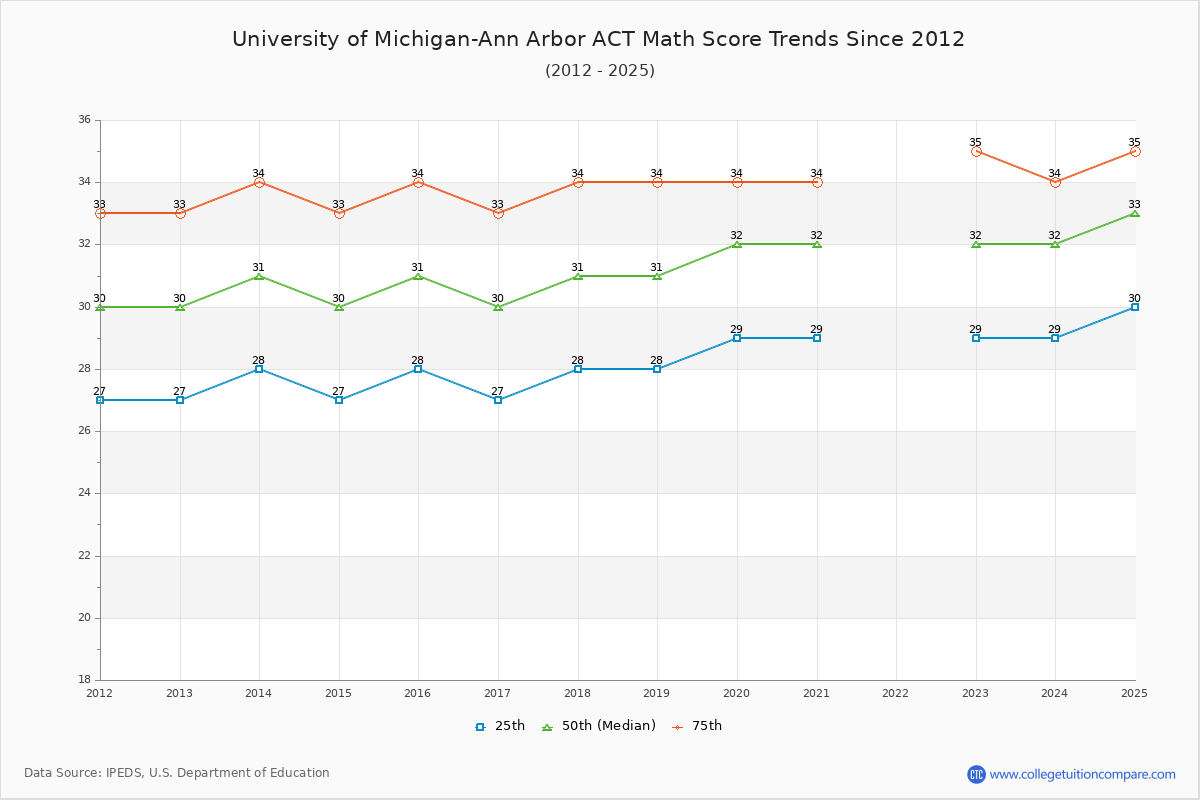
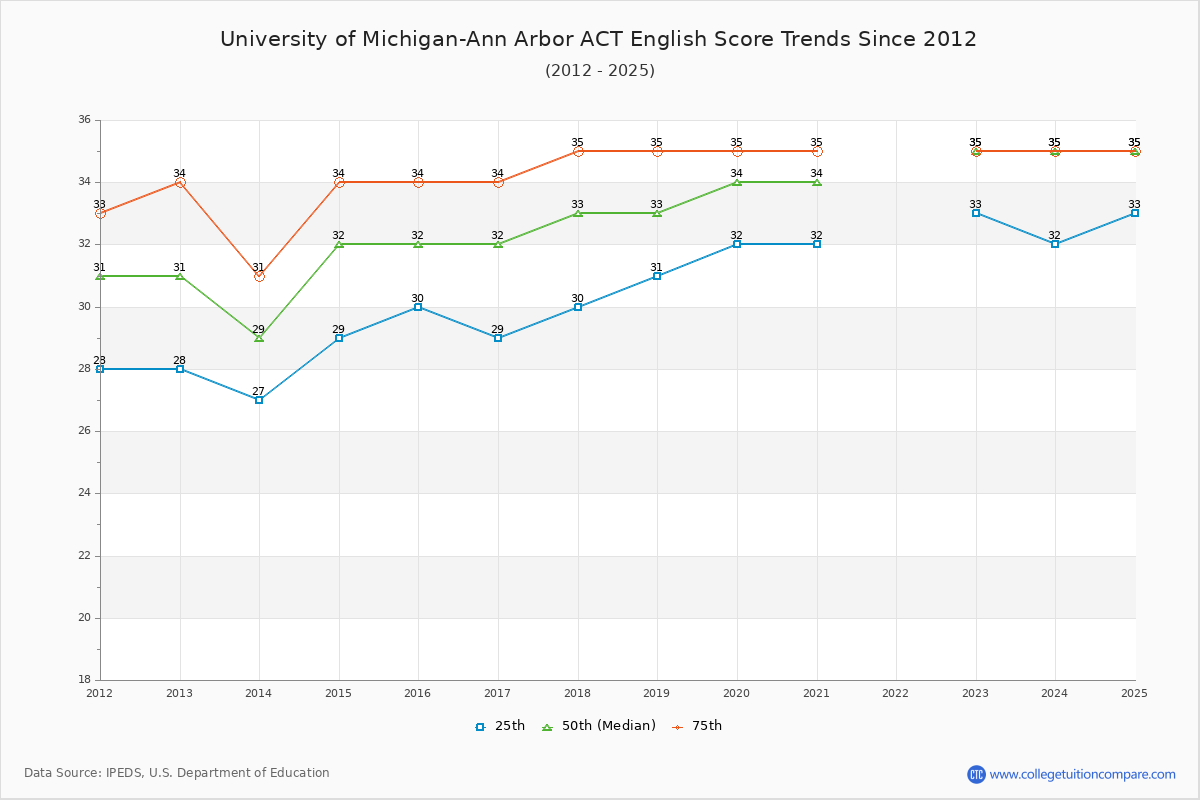
The 2024 ACT score is 33 at UM-Ann Arbor. Over the past 12 years, the average ACT score of the last 12 years is 30 (25 th percentile) and 33 (75 th percentile). Compared to similar schools, the submitted ACT scores are competitive and high at UM-Ann Arbor.
The following table and chart show the changes in ACT scores at University of Michigan-Ann Arbor since 2013.
| Year | Composite | English | Math | ||||||
|---|---|---|---|---|---|---|---|---|---|
| 25 th | 50 th | 75 th | 25 th | 50 th | 75 th | 25 th | 50 th | 75 th | |
| 2013-14 | 28 | 30 | 32 | 27 | 29 | 31 | 28 | 31 | 34 |
| 2014-15 | 29 | 31 | 33 | 29 | 32 | 34 | 27 | 30 | 33 |
| 2015-16 | 29 | 31 | 33 | 30 | 32 | 34 | 28 | 31 | 34 |
| 2016-17 | 29 | 31 | 33 | 29 | 32 | 34 | 27 | 30 | 33 |
| 2017-18 | 30 | 32 | 33 | 30 | 33 | 35 | 28 | 31 | 34 |
| 2018-19 | 30 | 32 | 34 | 31 | 33 | 35 | 28 | 31 | 34 |
| 2019-20 | 31 | 33 | 34 | 32 | 34 | 35 | 29 | 32 | 34 |
| 2020-21 | 31 | 33 | 34 | 32 | 34 | 35 | 29 | 32 | 34 |
| 2022-23 | 31 | 33 | 34 | 33 | 35 | 35 | 29 | 32 | 35 |
| 2023-24 | 31 | 33 | 34 | 32 | 35 | 35 | 29 | 32 | 34 |
| Average | 30 | 32 | 33 | 31 | 33 | 34 | 28 | 31 | 34 |
Share your experiences and thoughts about University of Michigan-Ann Arbor. It will be a great help to applicants and prospective students!